Loach Sampling Map
Visualizing loach sampling locations for project with HKU
By Chi Kit Yeung in R Data Visualization Geospatial
January 12, 2023
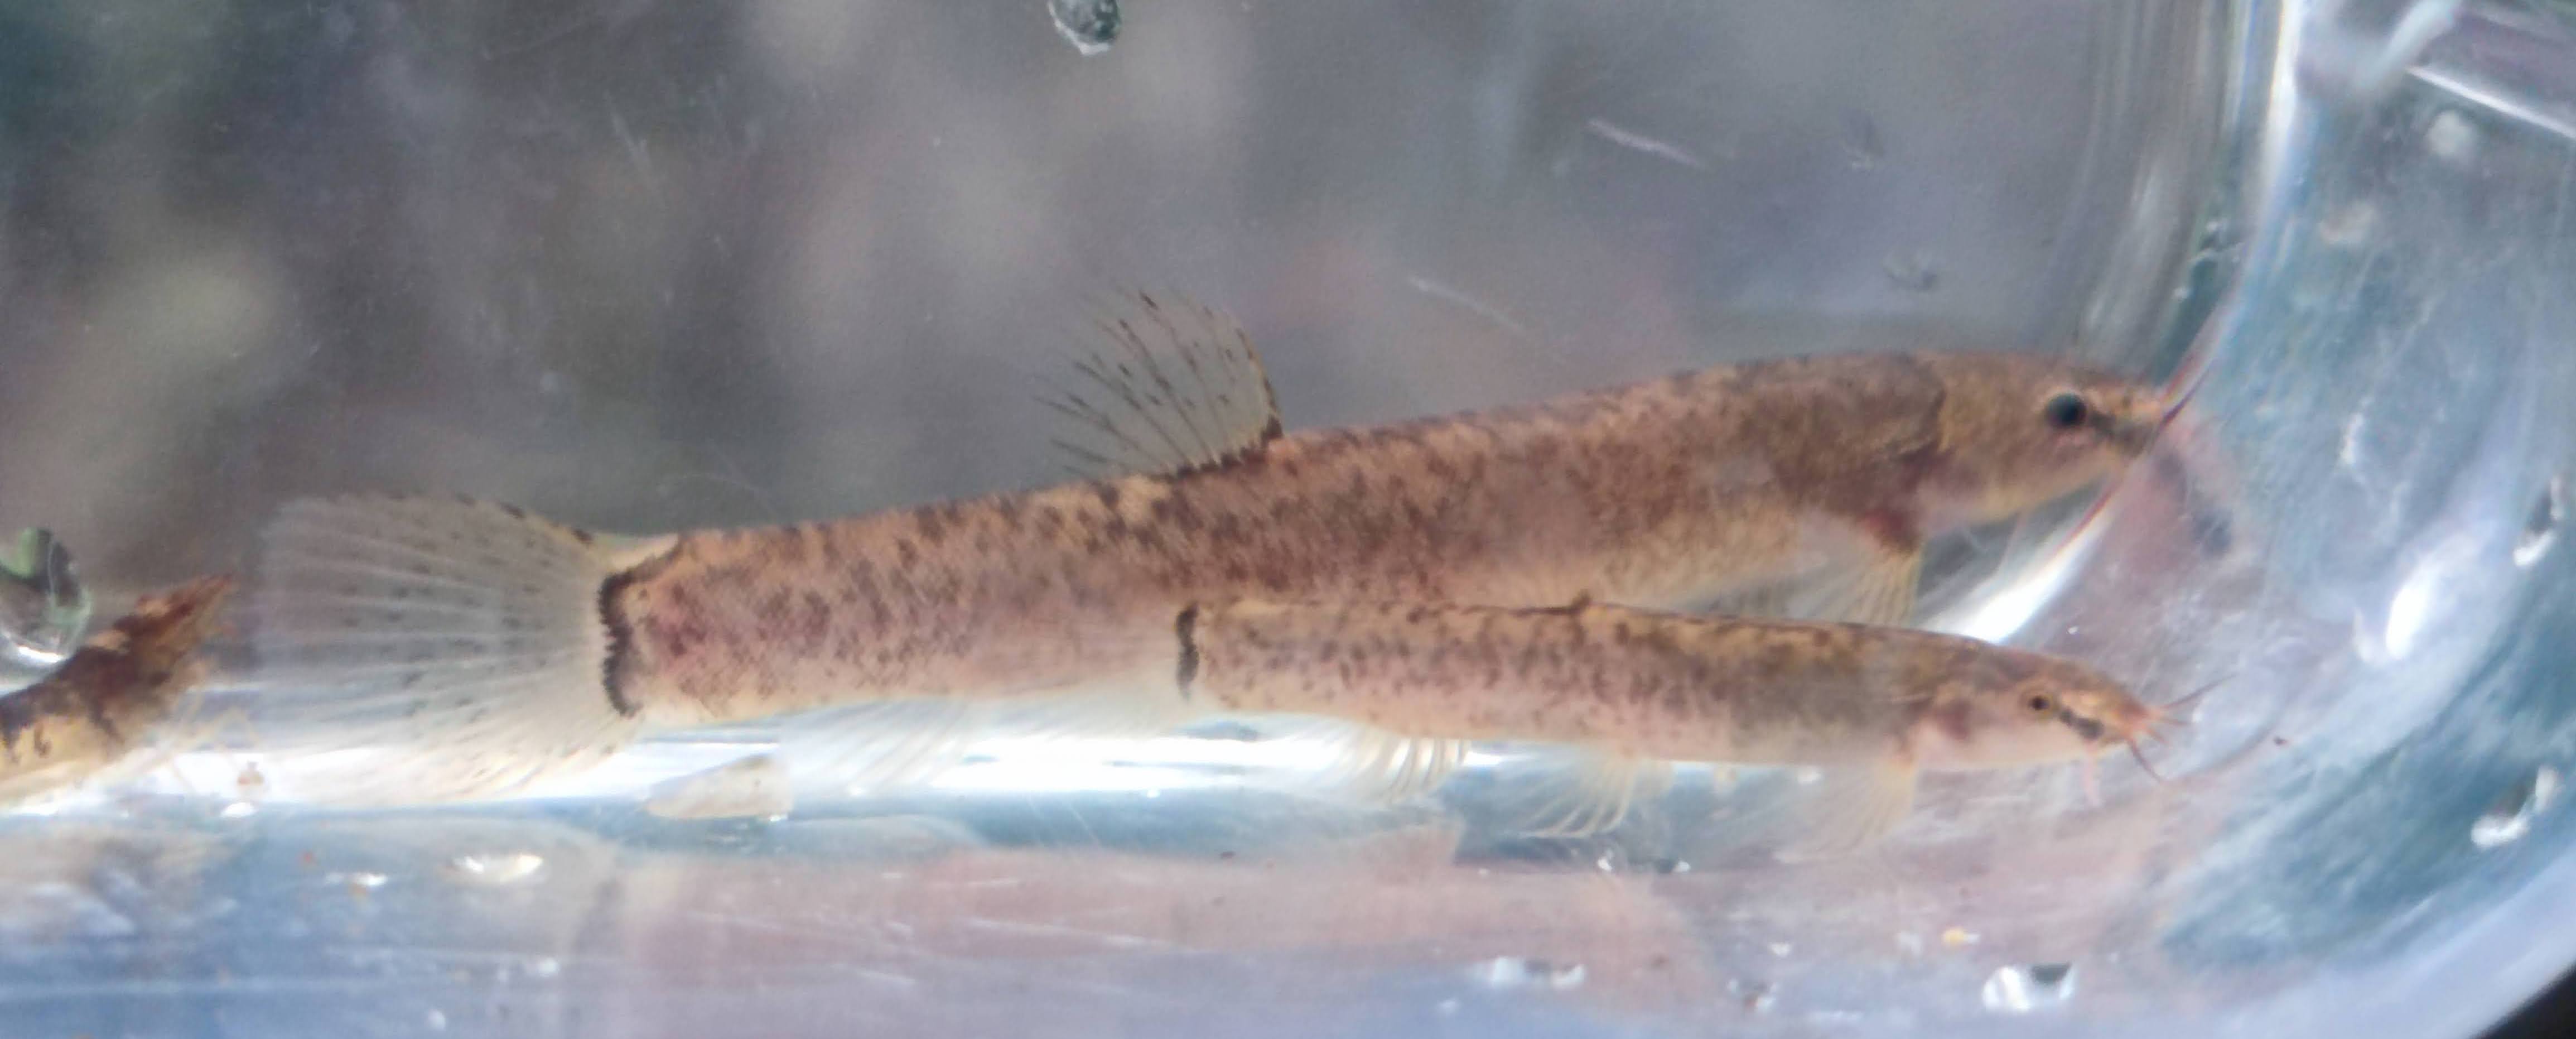 Flat-Headed Loach (Oreonectes platycephalus). Photo by
me
Flat-Headed Loach (Oreonectes platycephalus). Photo by
me
An interactive map built with Leaflet package in R to visualize Oreonectes platycephalus (Flat-Headed Loach) sampling locations
❗ Note: Actual locations redacted/modified to protect fish privacy ❗
The Map
# Install required packages if they are not installed already
list.of.packages <- c(
  "tidyverse",
  "janitor",
  "ggplot2",
  "leaflet",
  "readxl"
)

new.packages <- list.of.packages[!(list.of.packages %in% installed.packages()[,"Package"])]

if(length(new.packages) > 0){
  install.packages(new.packages, dep=TRUE)
}

# Loading the Packages
for(package.i in list.of.packages){
  suppressPackageStartupMessages(
    library(
      package.i,
      character.only = TRUE
    )
  )
}

########

# Import Data
site_info <- read.csv('data/site_info_table.csv') %>%
  clean_names()

hk_shape <- read.csv('data/hk_shapefile.csv') %>%
  clean_names()

sample_info <- read.csv('data/sample_info_table.csv') %>%
  clean_names()

# Data Prep
data.success <- site_info %>%
  filter(number_of_individuals_sampled == 20)

data.fail <- site_info %>%
  filter(number_of_individuals_sampled == 0) %>%
  filter(e_dna == 'No')

data.edna <- site_info %>%
  filter(number_of_individuals_sampled == 0) %>%
  filter(e_dna == 'Yes')

data.incomplete <- site_info %>%
  filter(number_of_individuals_sampled != 0) %>%
  filter(number_of_individuals_sampled < 20)

data.pending <- site_info %>%
  filter(number_of_individuals_sampled == 'Planned')

# Graphics
## Labels
generate_marker_labels <- function(data) {
  label <- lapply(seq(nrow(data)), function(i) {
    paste0( '<p><h3>', data[i, "site_full_name"], '</h3><p></p><i>',
            data[i, "n"], ', ', data[i, "e"], '</i><p></p>',
            'Site: <i>', data[i, "site"], '</i><p></p>',
            '# sampled: <i>', data[i, "number_of_individuals_sampled"],'</i></p><p>',
            'Year: <i>', data[i, "year"], '</i></p>' )
  })
  return(label)
}

labs.success <- generate_marker_labels(data.success)

labs.fail <- generate_marker_labels(data.fail)

labs.incomplete <- generate_marker_labels(data.incomplete)

labs.edna <- generate_marker_labels(data.edna)

labs.pending <- generate_marker_labels(data.pending)


## Icons
icon.success <- makeAwesomeIcon(
  icon = "checkmark",
  library = "ion",
  markerColor = "darkgreen",
  iconColor = "#FFFFFF"
)

icon.incomplete <- makeAwesomeIcon(
  icon = "minus",
  library = "fa",
  markerColor = "orange",
  iconColor = "#FFFFFF"
)

icon.fail <- makeAwesomeIcon(
  icon = "times",
  library = "fa",
  markerColor = "red",
  iconColor = "#FFFFFF"
)

icon.edna <- makeAwesomeIcon(
  icon = "times",
  library = "fa",
  markerColor = "darkblue",
  iconColor = "#FFFFFF"
)

icon.pending <- makeAwesomeIcon(
  icon = "calendar",
  library = "fa",
  markerColor = "gray",
  iconColor = "black"
)

# Mapping
map <- leaflet() %>%

  ## Base group
  addProviderTiles("Esri.WorldTopoMap", group = "Esri Topographic",
                   options = providerTileOptions(minZoom = 10)) %>%

  ## Overlay group
  ### Markers
  addAwesomeMarkers(data = data.success,
                    lat = ~ n, lng = ~ e,
                    label = lapply(labs.success, htmltools::HTML),
                    icon = icon.success,
                    group = "Loach") %>%

  addAwesomeMarkers(data = data.fail,
                    lat = ~ n, lng = ~ e,
                    label = lapply(labs.fail, htmltools::HTML),
                    icon = icon.fail,
                    group = "No Loach") %>%

  addAwesomeMarkers(data = data.incomplete,
                    lat = ~ n, lng = ~ e,
                    label = lapply(labs.incomplete, htmltools::HTML),
                    icon = icon.incomplete,
                    group = "Loach") %>%

  addAwesomeMarkers(data = data.edna,
                    lat = ~ n, lng = ~ e,
                    label = lapply(labs.edna, htmltools::HTML),
                    icon = icon.edna,
                    group = "eDNA") %>%

  addAwesomeMarkers(data = data.pending,
                    lat = ~ n, lng = ~ e,
                    label = lapply(labs.pending, htmltools::HTML),
                    icon = icon.pending,
                    group = "Planned") %>%

  # Controls
  addLayersControl(
    baseGroups = c("Esri Topographic"),
    overlayGroups = c("Loach", "No Loach", "eDNA", "Planned"),
    options = layersControlOptions(collapsed = FALSE)
  )
Introduction
One of the research that Merilä Labs, The University of Hong Kong’s unit I’m part of, is conducting is on genetic diversity of the Flat-Headed Loach (O. platycephalus). These fish have a fragmented distribution in small hillstream pools across the territory. They are also found in some areas of Southern China. When their habitats are so disconnected, how did they get to where they are? Are they genetically the same fish? To answer that question we’ll need to sample different populations from different streams and then compare their DNA. This map is merely a tool to help us manage the sampling.
Features
To serve the purpose of this project, the map should have the following features:
- Visualize locations sampled/planned
- Return metadata per site
- Toggle filters
Packages Used
"tidyverse"
"janitor"
"ggplot2"
"leaflet"
"readxl"
🎉 Thank you for reading! Please feel to give suggestions, share your thoughts, or just say Hi
- Posted on:
- January 12, 2023
- Length:
- 3 minute read, 602 words
- Categories:
- R Data Visualization Geospatial
- See Also: